Display
This page is about how the traces are drawn: their amplitude (gain), their time scale and the options of the view. Everything you set here is kept with the recording and found again when you reopen it.
Gain
The gain is the amplitude of the traces. It is given per centimetre of the screen: with a gain of
70 µV/cm for the EEG, a deflection of 1 cm on the screen is a signal of 70 µV. The smaller the number, the larger
the traces.
In the navigation bar:
- + makes the traces larger, - makes them smaller, for all the channel types of the view;
- the button between them (the traces icon) opens the Gain Levels window, where you set the gain of each type of channel on its own.
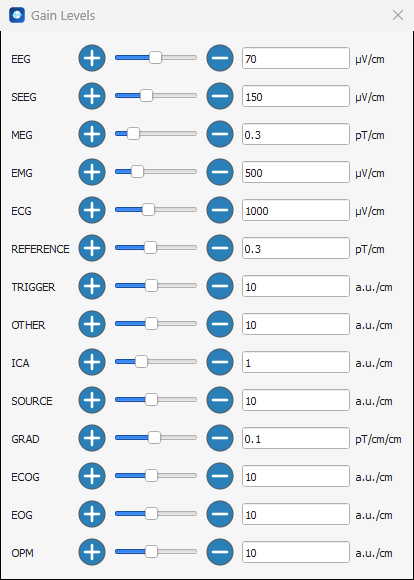
In Gain Levels, each type of channel has its own + and - buttons, a slider and a box where you type the
value, with its unit: µV/cm for EEG, SEEG, EMG and ECG, pT/cm for MEG... Changes apply at once to the views.
Time scale
AnyWave imitates the traces that were once written on paper: the time scale is given in seconds per centimetre. Because the scale is a physical one, a page looks the same whatever the size of the window. A larger window simply shows more seconds.
Change the s/cm value in the navigation bar, by choosing one in the list (from 0.01 to 5 s/cm) or by typing another one. For example, 0.3 s/cm is close to the 30 mm/s of a clinical EEG, and a larger value such as 2 s/cm squeezes the signal to see slow events.
If you prefer the page to last a given time rather than to have a given scale, switch to a fixed page duration in the view settings (Time Scale > Fixed page duration). The s/cm list is then replaced by a Window duration list, with 10, 20, 30, 40 or 50 seconds.
View settings
The eye button, at the right of the navigation bar, opens the View settings.
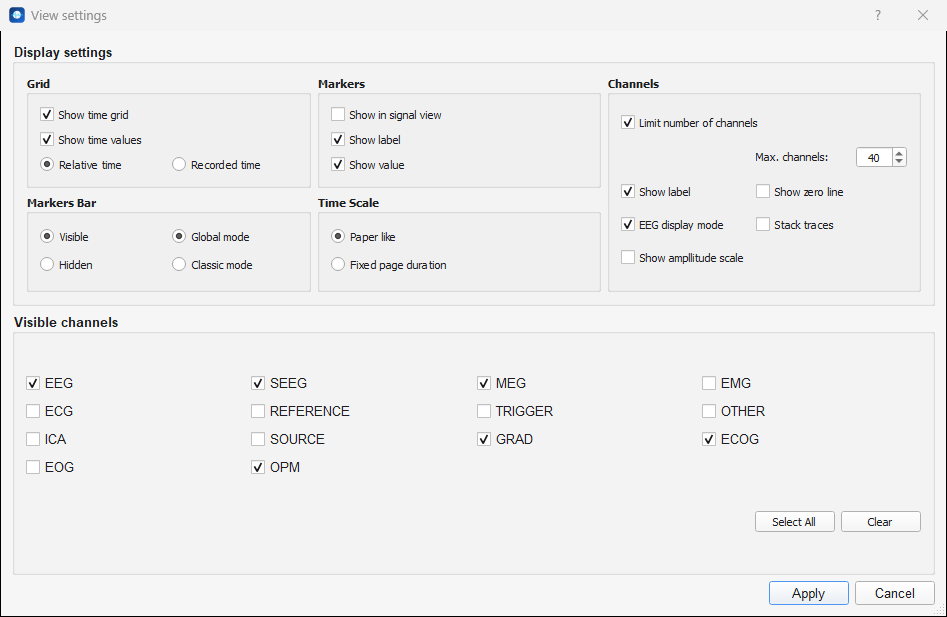
Click Apply to keep your choices, Cancel to forget them.
| Group | Option | Effect |
|---|---|---|
| Grid | Show time grid | Draws a vertical dotted line every second over the traces. |
| Show time values | Writes the time at the top and at the bottom of the view. | |
| Relative time / Recorded time | The time values count the seconds from the beginning of the recording, or show the clock time at which they were recorded. The clock time is only available when the file knows when the recording started. | |
| Markers | Show in signal view | Draws the markers in the view. Off by default. |
| Show label, Show value | What is written next to each marker. | |
| Markers Bar | Visible / Hidden | Shows or hides the markers bar. |
| Global mode / Classic mode | The two modes of the bar. | |
| Time Scale | Paper like / Fixed page duration | See Time scale. |
| Channels | Limit number of channels, Max. channels | Fits at most this number of channels in the height of the view (40 by default). When the view has more channels, the traces keep a readable spacing and you scroll vertically to reach the others (or use Go to channel). Without the limit, all the channels are squeezed into the height of the view. |
| Show label | Writes the name of each channel at the left of its trace. | |
| Show zero line | Draws a baseline for each trace. | |
| EEG display mode | When ticked (the default), EEG traces are drawn with negative values upwards, as in clinical EEG. Untick it to draw positive values upwards. | |
| Stack traces | Draws the traces of a same type on top of each other, instead of one under the other. | |
| Show amplitude scale | Adds a scale of the amplitude to the view. | |
| Visible channels | One box per type | Only the channels of the ticked types are displayed. Select All and Clear tick and untick them all. |
Tip
Visible channels is the quickest way to look at one kind of signal at a time. A recording with EEG, ECG and EOG channels can be looked at with the EEG only, then with the ECG only, without touching the montage. To see two kinds at the same time with a different scale for each, use two views.